


Introduction
The complex association between proteins and signal transduction pathways that control cellular function are dependent upon a variety of weak and transient dynamic interactions, which are often difficult or even impossible to characterize by traditional biochemical methodology. Fluorescence microscopy has demonstrated excellent sensitivity in the detection of exceedingly low concentrations of labeled biomolecules over very broad spatial and temporal dimensions. With the introduction and development of high-performance, genetically-encoded fluorescent proteins that can be stably expressed in living cells, several fluorescence techniques have emerged as powerful tools to visualize dynamic protein interactions in situ under physiological conditions. In particular, the application of Förster resonance energy transfer (FRET) is becoming increasingly popular to serve as a molecular ruler in the determination of intermolecular distances or to demonstrate whether or not molecular complexes are even formed. In order to construct biomolecules potentially capable of FRET interaction, simple molecular biology techniques can be used to fuse the cDNA encoding fluorescent proteins to that of the target proteins believed to be involved. The currently preferred fluorescent proteins for FRET analysis are Aequorea victoria jellyfish GFP derivatives featuring cyan and yellow emission (ECFP and EYFP) as donors and receptors, respectively. Although ECFP and EYFP have been used in numerous FRET investigations, several newer and more advanced variants, Cerulean (a cyan derivative) and Citrine or Venus (yellow derivatives), have proven to be highly effective in providing the increased dynamic range that is necessary to carefully monitor sensitive FRET signals. In addition, continued expansion of the fluorescent protein color palette is providing new candidates in the orange, red, and far-red spectral region as potential FRET partners for existing cyan, green, and yellow proteins.
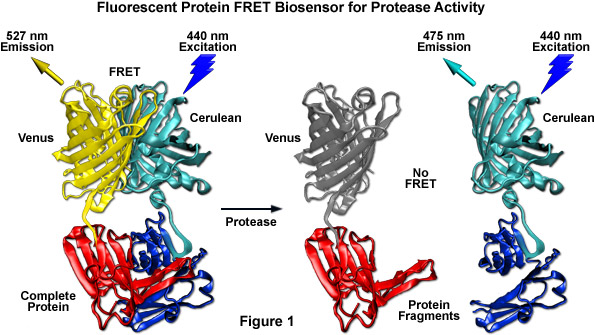
Among the most useful FRET applications in cell biology is a technique that involves the fusion of two fluorescent proteins to the ends of an environmentally sensitive protein or peptide to act as a biosensor of specific cellular functions. Fluorescent protein biosensors have found widespread utility in reporting on a diverse array of intracellular processes. By creatively fusing FRET-capable pairs of fluorescent proteins to biopolymers that perform critical functions involved in various aspects of physiological signaling, research scientists have developed a host of new molecular probes that are useful for optical live-cell imaging of important processes such as calcium wave induction, cyclic nucleotide messenger effects, pH, membrane potential fluctuations, phosphorylation, and intracellular protease action. Perhaps the most widely used biosensor design to screen new or improved FRET pairs involves a protease cleavage assay (see Figure 1). The simple motif consists of two fluorescent proteins (in this case, Cerulean and Venus) linked together by a short peptide that contains a consensus protease cleavage site. In general, the sensor exhibits very strong resonance energy transfer that is completely abolished upon cleavage of the linker sequence. Because the technique usually features high dynamic range levels, it can be used to screen new cyan and green FRET donors with yellow, orange, and red acceptors. The largest family of protease biosensors incorporates a cleavage site sensitive to one of the caspase family of proteases, which enables the sensor to be examined during induction of apoptosis.
back to top ^Principles of Förster resonance energy transfer (FRET)
Typical fluorescence microscopy techniques rely upon the absorption of light by a fluorophore at one wavelength (excitation), followed by the subsequent emission of secondary fluorescence at a longer wavelength. The excitation and emission spectral profile maxima (peaks) are separated from each other by variable bandwidths, ranging from tens to hundreds of nanometers. Labeling of intracellular components, such as the nuclei, mitochondria, cytoskeleton, and membranes, with specific fluorophores enables their localization within fixed and living preparations. By simultaneously labeling several sub-cellular structures with individual fluorophores having separated excitation and emission spectra, specialized fluorescence filter combinations can be employed to examine the proximity of labeled molecules within a single cell or tissue section. Using this technique, molecules that are closer together than the optical resolution limit appear to be coincident (and are said to colocalize). This apparent spatial proximity implies that a molecular association is possible. In most cases, however, the normal diffraction-limited fluorescence microscope resolution is insufficient to determine whether an interaction between biomolecules actually takes place. FRET is a process by which radiationless transfer of energy occurs from an excited state fluorophore (the donor) to a second fluorophore (the acceptor) in close proximity. Because the range over which the energy transfer can take place is limited to approximately 10 nanometers (100 Angstroms), and the efficiency of transfer is extremely sensitive to the separation distance between fluorophores, FRET measurements can be a valuable tool for probing molecular interactions.
The fundamental mechanism of FRET involves a donor fluorophore in an excited electronic state, which is capable of transferring its excitation energy to a nearby acceptor fluorophore (or chromophore) in a non-radiative fashion through long-range, dipole-dipole interactions. The theory supporting energy transfer is based on the concept of treating an excited-state fluorophore as an oscillating dipole that can undergo an energy exchange with a second dipole having a similar resonance frequency. In this regard, resonance energy transfer is analogous to the behavior of coupled oscillators, such as a pair of tuning forks vibrating at the same frequency. In contrast, radiative energy transfer (which does not occur in FRET) requires emission and subsequent re-absorption of a photon, and depends on the physical dimensions and optical properties of the specimen, as well as the geometry of the container and the wavefront pathways. Unlike radiative mechanisms, resonance energy transfer can yield a significant amount of structural information concerning the donor-acceptor pair.
Resonance energy transfer is not sensitive to the surrounding solvent shell of a fluorophore, and thus, produces molecular information unique to that revealed by solvent-dependent events, such as fluorescence quenching, excited-state reactions, solvent relaxation, or anisotropic measurements. The major solvent impact on fluorophores involved in resonance energy transfer is the effect on spectral properties of the donor and acceptor. Non-radiative energy transfer occurs over much longer distances than short-range solvent effects and the dielectric nature of constituents (solvent and host macromolecule) positioned between the involved fluorophores has very little influence on the efficacy of resonance energy transfer, which depends primarily on the distance between the donor and acceptor fluorophore.
The phenomenon of FRET is not mediated by photon emission, and furthermore, does not even require the acceptor chromophore to be fluorescent. In most applications, however, both donor and acceptor are fluorescent, and the occurrence of energy transfer manifests itself through quenching of donor fluorescence and a reduction of the fluorescence lifetime, accompanied also by an increase in acceptor fluorescence emission (from which the experimental FRET efficiency can be extracted). If the acceptor is fluorescent, it will emit photons according to its characteristic spectral profile, thus producing a measurable ratiometric signal change. A large ratio of acceptor to donor intensity is indicative of a high FRET efficiency that can likewise be attributed to a shorter distance or more favorable orientation between the fluorophores. The efficiency of the energy transfer process (EFRET) varies in proportion to the inverse sixth power of the distance separating the donor and acceptor molecules (r) as outlined in the equation presented below. Consequently, FRET measurements can be utilized as an effective molecular ruler for determining the distances between biomolecules labeled with an appropriate donor and acceptor fluorophore when they are within 10 nanometers of each other. Thus, FRET efficiency can be mathematically described as:
EFRET = 1/[1 + (r/R0)6]
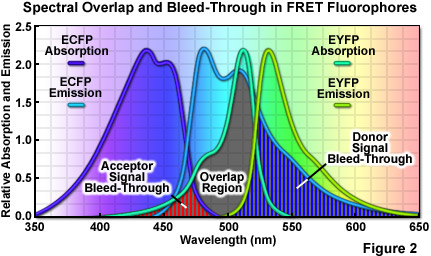
where R0 (commonly referred to as the Förster radius) represents the characteristic distance where the FRET efficiency is 50 percent. In addition to the proximity requirement, efficient transfer of energy requires a significant spectral overlap between the donor emission and the acceptor absorption spectra (as illustrated in Figure 2). Efficiency is improved by increasing the quantum yield of the donor and/or the extinction coefficient of the acceptor. For example, ECFP has a quantum yield of 0.40 whereas that of Cerulean is approximately 50 percent greater, thus increasing the FRET efficiency when Cerulean is substituted for ECFP as a FRET donor. Likewise the extinction coefficient of Venus is approximately 11 percent higher than that of EYFP, making Venus the superior FRET acceptor. In general, the spectral overlap between the donor and acceptor should be sufficient to provide a Förster radius that is approximately 4 nanometers or more. Another important parameter that should be addressed when selecting fluorescent proteins as FRET pairs is matching the relative maturation rates. The amount of time necessary for maturation of the chromophore ranges from several minutes to many hours, depending upon the particular protein and can vary widely within otherwise closely related variants. FRET measurements will be compromised in cases where the donor fluorescent protein matures substantially faster or slower than the acceptor.
A wide variety of other factors must be considered in order to optimize FRET measurements. One of the primary issues is the relative brightness of the donor and acceptor fluorophores. In general, due to the limited dynamic range of most microscopes, fluorophores that are comparable in brightness tend to yield more satisfactory results. A significant mismatch in brightness often leads to signal from one fluorophore saturating the detector channel, while the signal from the other (dimmer) fluorophore is lost in the noise floor. Another pitfall that often occurs is direct excitation of the acceptor at the wavelength used to excite the donor, leading to excess acceptor emission that does not result from FRET. This artifact is referred to as acceptor spectral bleed-through. Additionally, fluorescence emission from the donor can leak into the acceptor detection channel (known as donor spectral bleed-through), which also results in artificially high FRET values (Figure 2). Due to the fact that these sources of bleed-through will be present in virtually all FRET pairs, they must be inevitably addressed during FRET measurements. Choosing FRET pairs that feature a large degree of separation between emission peaks reduces bleed-through, but also might compromise the amount of spectral overlap. Too often, the result will be a large decrease in FRET signal that offsets any reduction of the spectral bleed-through problem.
back to top ^Fluorescent Proteins in FRET Analysis
The choice of suitable probes for examining FRET in living cells is limited. Synthetic fluorophores, which are ideal for resonance energy transfer investigations in fixed cells, are difficult to administer and target in live cells. Likewise, quantum dots can be utilized to label membrane components for examination of phenomena on the exterior of the plasma membrane, but these probes are unable to penetrate the membrane and are therefore of little use in intracellular compartments such as the nucleus, mitochondria, Golgi complex, or endoplasmic reticulum. Genetically encoded fluorescent proteins currently are among the best candidate fluorophores for high-resolution imaging of FRET in live cells. However, many of the typical artifacts that are encountered in measuring FRET with synthetic fluorophores and quantum dots are particularly acute when applied to fluorescent proteins. For example, unlike the 30-40 nanometer full-width at half maximum (FWHM) bandwidth featured by the emission spectral profiles in many synthetic dyes, those in fluorescent proteins range from approximately 60 nanometers to well over 100 nanometers, often leading to significant regions of overlap when attempting to segregate donor and acceptor fluorescence. Thus, the broad spectral profiles of fluorescent proteins limit the number of probes that can be used together in FRET and other types of imaging experiments.
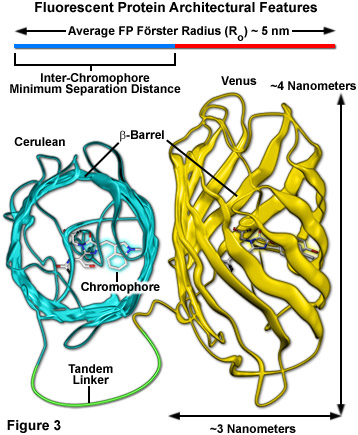
Surrounding the fluorescent protein chromophore is a 220-230 amino acid polypeptide wound into a three-dimensional cylindrical structure approximately 2.4 by 4.2 nanometers in size (termed a beta-barrel; see Figure 3), and composed of extensively hydrogen-bonded beta-sheets that surround and protect a central alpha-helix containing the residues that form the chromophore. The ends of the barrel are capped with semi-helical peptide regions that serve to block entry of ions, water, and small molecules. The interior of the protein is so tightly packed with amino acid side chains and water molecules that there is little room for diffusion. These favorable structural parameters, which are partially responsible for the resilient photostability and excellent performance of fluorescent proteins, also contribute to a reduction in FRET efficiency (Figure 3). The large size of the barrel effectively shields adjacent fluorescent protein chromophores with peptide residues (to a limiting close approach distance of 2 to 3 nanometers), resulting in a reduction of the maximum FRET efficiency that can be obtained with fluorescent proteins to approximately 40 percent of the theoretical value. Regardless, the numerous benefits of using fluorescent proteins for live cell FRET imaging far outweigh the costs.
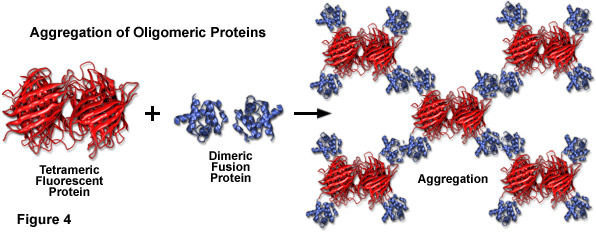
Compounding the spectral bandwidth and size problems encountered with fluorescent proteins is also their high affinity for oligomerization. Almost all of the fluorescent proteins discovered to date display at least a limited degree of quaternary structure, as exemplified by the weak tendency of native Aequorea victoria jellyfish green fluorescent protein and its derivatives to dimerize when immobilized at high concentrations (for example, when constrained to the plasma membrane). This artifact has also been observed in the strict tetramerization motif of the native yellow, orange, and red fluorescent proteins isolated in reef corals and sea anemones. Oligomerization can be a significant problem for many applications in cell biology, particularly in cases where the fluorescent protein is fused to a host protein that is targeted at a specific subcellular location. Once expressed, the formation of dimers and higher order oligomers induced by the fluorescent protein portion of the chimera can produce atypical localization, disrupt normal function, interfere with signaling cascades, or restrict the fusion product to aggregation within a specific organelle or the cytoplasm. This effect is particularly marked when the fluorescent protein is fused to partners which themselves participate in natural oligomer formation (such as actin, tubulin, and gap junctions; see Figure 4). Fusion products with proteins that form only weak dimers (in effect, most Aequorea victoria variants) may not exhibit aggregation or improper targeting, provided the localized concentration remains low. However, when weakly dimeric fluorescent proteins are targeted to specific cellular compartments, such as the plasma membrane as described above, the localized protein concentration can become high enough to permit dimerization. This phenomenon can be a particular concern when conducting intermolecular FRET experiments, which often yield complex data sets that are sometimes compromised by dimerization artifacts. On the other hand, the naturally occurring weak dimerization in jellyfish proteins can, in some cases, be utilized to increase the FRET signal in biosensors that otherwise would exhibit limited dynamic range.
Cellular distress leading to apoptosis or necrosis is an issue that occurs due to excessive concentrations of synthetic fluorophores and the over-expression or aggregation of poorly localized fluorescent proteins. Furthermore, the health and longevity of optimally labeled mammalian cells in microscope imaging chambers can also suffer from a number of other deleterious factors. Foremost among these is the light-induced damage (phototoxicity) that occurs upon repeated exposure of fluorescently labeled cells to illumination from lasers, LEDs, and high-intensity arc-discharge lamps. In their excited state, fluorescent molecules are prone to react with molecular oxygen to produce free radicals that can damage subcellular components and compromise the entire cell. Fluorescent proteins are generally not phototoxic to cells, partially due to the fact that their fluorophores are buried deep within a protective polypeptide envelope (see Figure 3). In designing FRET experiments, fluorescent protein combinations that exhibit the longest excitation wavelengths possible should be chosen in order to minimize damage to cells by short wavelength illumination, especially in long-term experiments. Thus, rather than creating fusion products and biosensors with blue or cyan fluorescent proteins (excited by ultraviolet and blue illumination, respectively), variants that emit in the yellow, orange, and red regions of the spectrum would be far more ideal. Unfortunately, the low absorption coefficients and quantum yields of monomeric orange and red fluorescent proteins have prevented their widespread application in FRET analysis. Perhaps as new fluorescent protein variants are discovered, probes in longer wavelength color regions will emerge as useful FRET acceptors for yellow and green donors.
Investigators should take care to perform the necessary control experiments when using new fluorescent protein biosensors and cell lines to ensure that cytotoxicity and phototoxicity artifacts do not obscure FRET results or interfere with other important biological phenomena. In some cases, lipophilic reagents induce deleterious effects that may be confused with fluorescent protein toxicity during imaging in cell lines following transient transfections. Oligomeric fluorescent proteins from reef corals (discussed above) have a far greater tendency to form aggregates (combined with poor subcellular localization) than do the monomeric jellyfish proteins, but improperly folded fusion products can occur with any variant. Recently, a fluorescent protein capable of generating reactive oxygen species (ROS) upon illumination with green light has been reported as an effective agent for inactivation of specific proteins by chromophore-assisted light inactivation (CALI). Appropriately named KillerRed, this genetically encoded photosensitizer is capable of killing both bacteria and eukaryotic cells upon illumination in the microscope. Previous studies on ECFP and EYFP phototoxicity indicate that even through the chromophores are capable of generating singlet oxygen, these probes are inefficient as photosensitizers. However, prolonged illumination of cells expressing any variant of EGFP can result in physiological alterations and eventual cell death, a definite indication of the potential for phototoxicity in long-term imaging experiments.
In live-cell experiments, fluorescent proteins are highly advantageous for extended time-lapse imaging due to their reduced rate of photobleaching when compared to synthetic fluorophores. Although there is a high degree of uncorrelated variability between fluorescent proteins in terms of photostability, most variants are useful for short-term imaging (from 1 to 25 captures), while several of the more photostable proteins can be employed in time-lapse sequences that span periods of 24 hours or longer (in which hundreds to thousands of images are gathered). The long term stability of any particular protein, however, must be investigated for every illumination scenario (widefield, confocal, spinning disk, multiphoton, etc.) because differences in photostability are often observed with the same protein when illumination is produced by an arc-discharge lamp versus a laser system. Thus, in terms of photostability, the selection of fluorescent proteins is dictated by numerous parameters, including the illumination conditions, the expression system, and the effectiveness of the imaging setup.
The first fluorescent protein pairing designed for FRET analysis was a blue variant (EBFP) combined with EGFP, designed for excitation with an ultraviolet light source. Unfortunately, the relatively poor photophysical properties of EBFP, along with the potential phototoxicity of short-wavelength illumination, rendered this combination impractical. Newer blue fluorescent protein variants may resurrect this pairing strategy for short-term observations, but they will still be hampered by the need for high-energy excitation, which will preclude the use of blue fluorescent proteins for long-term imaging. The most effective fluorescent protein FRET pair remains a high-performance ECFP variant as the donor coupled to a high-performance EYFP variant as the acceptor. Other pairings include an EGFP or EYFP derivative as a donor to orange and red variants such as monomeric Kusabira Orange or mCherry. Among the problems associated with the application of orange and red fluorescent proteins (all derived from reef corals and sea anemones) as FRET acceptors is the long excitation tails featured in the absorption spectral profiles. In many cases, the absorption spectra extend into the cyan and green spectral regions leading to direct acceptor excitation artifacts.
Properties of Fluorescent Protein Pairs for FRET Spectral Imaging
|
|||||||||||||||||||||||||||||||||||||||||||||||||||||||||||||||||||||||||||||||
Table 1
The recent expansion of the fluorescent protein color palette to generate variants possessing a wide array of spectral profiles, coupled to the increasing sophistication of protein chimera design (fusions as well as biosensors), has resulted in a number of potential fluorescent protein pairs that are potentially useful in FRET experiments (see Table 1). Application of fluorescent proteins to FRET involves either integrating a selected pair into a biosensor (a single genetically-encoded construct, as discussed briefly above) or conducting intermolecular measurements between two separate proteins, each fused to a different fluorescent protein. The latter approach has been employed to image a variety of protein interactions, including oligomerization of receptors and elucidating the functions of transcription factors. However, conducting FRET assays on independently expressed protein chimeras is far more difficult due to the variable stoichiometry that inevitably occurs when separate fluorescent entities are expressed in living cells. Regardless of the difficulty, experiments of this nature can yield informative results when appropriate controls are installed and the investigation is conducted with exacting precision.
back to top ^Techniques for Measuring FRET
Due to the fact that virtually all fluorophore combinations used to monitor FRET are hampered by distinct, and often unique, problems that complicate their application for this technique, it is mission-critical for the investigator to completely understand the methodology under which FRET is being measured. Researchers should use as many different measurement techniques as are feasible when conducting pilot experiments on new FRET combinations with biological implications. After the system has been fine-tuned and the results are consistent and well understood, the simplest experimental approaches can then be utilized for additional measurements. Although a large number of methods have been developed to measure FRET, many are highly complex and require equipment that is not available in most core microscopy facilities. The most practical approaches to measuring FRET are limited to several methods that will be discussed below.
The high degree of spectral overlap between the donor emission and acceptor absorption profiles that is required in FRET also generates a substantial level of background noise that can significantly interfere with the detection of FRET signals. As previously discussed, spectral bleed-through is perhaps the primary concern with separating FRET signals for analysis. Both the donor and acceptor usually contribute to the bleed-through that can be detected in the FRET channel. Bleed-through contributions from the donor result from the overlap of the donor and acceptor fluorescence emission profiles, which are often very broad (ranging in excess of 100 nanometers) and difficult to separate. In contrast, bleed-through from the acceptor results from direct excitation of acceptor fluorophores by the illumination that is used to excite the donor and produce FRET. A wide variety of other noise sources can also contaminate the measured FRET signal. These include autofluorescence, microscope detector and optical noise, and spectral sensitivity variations in the donor and acceptor channels. As a result, the most useful approach for the measurement of accurate FRET signals requires the application of methodology that can either avoid or successfully remove contaminating background signals.
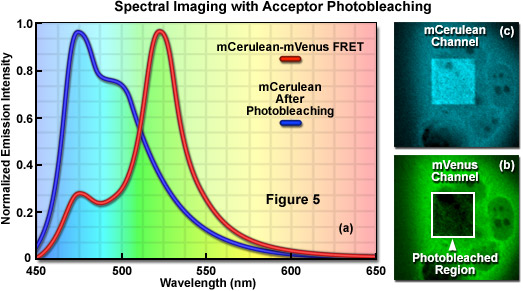
Signal bleed-though can be largely avoided using FRET methods such as acceptor photobleaching (also commonly referred to as donor dequenching; see Figure 5) and fluorescence lifetime imaging microscopy (FLIM), but these techniques can also introduce other limitations. The acceptor photobleaching technique is used to determine FRET efficiency by measuring the magnitude of the quenched donor signal (Figure 5(a)) in the presence of the acceptor, followed by measuring the de-quenched donor signal after the acceptor fluorescence has been destroyed by photobleaching (Figure 5(b) and 5(c)). The underlying concept in acceptor photobleaching FRET is that donor fluorescence is quenched as a result of resonance energy transfer to the acceptor. As a result, photobleaching the acceptor increases donor fluorescence due to loss of the quenching effect. Thus, if FRET occurs between the donor and acceptor, the donor fluorescence must increase when the acceptor is effectively removed after photobleaching. Among the advantages of acceptor photobleaching is that each cell being investigated serves as its own control, which renders this technique among the most accurate for measuring FRET.
The main concern in performing acceptor photobleaching FRET measurements is to ensure that the donor is not also photobleached, and that the acceptor is photobleached to (at the least) approximately 10 percent if its initial value. Any photobleaching that occurs to the donor will lead to an underestimation of the FRET efficiency due to lost signal. In addition, because the acceptor is irreversibly photobleached (in effect, destroyed), the acceptor photobleaching technique cannot be repeated on the same cell. Furthermore, because of the high photostability exhibited by many fluorescent proteins, acceptor photobleaching can take several minutes and is less useful for dynamic measurements in living cells. Acceptor photobleaching measurements can also be compromised unless the entire cell is bleached in a single step. Photobleaching a selected region in the cytoplasm allows the influx of fresh fluorophores into the bleached region, which increases the time necessary to bleach all of the acceptor molecules in the cell. Aside from these problems, acceptor photobleaching is still widely used to determine FRET efficiencies and provides an excellent control after conducting experiments that rely on alternative methods.
Monitoring the donor fluorescence lifetime in FRET experiments can be utilized to avoid many of the problems often encountered with acceptor photobleaching techniques. FLIM is perhaps the most rigorous technique used for measuring FRET and is less prone to bleed-through artifacts because it measures only fluctuations in donor fluorescence. All fluorophores, including fluorescent proteins, exhibit an exponential decay in their fluorescence emission that can be measured on the nanosecond timescale. The rate of this exponential decay is sensitive to any processes that influence the excited state, including a host of environmental variables that can quench fluorescence. As such, the basic concept surrounding FLIM is related to acceptor photobleaching in that it can be used to detect changes in donor fluorescence lifetime that accompany the transfer of energy to the acceptor. In effect, the donor fluorescence is quenched by FRET and the amount of this quenching can be determined by measuring the changes in fluorescence lifetime of donor in the presence and absence of an acceptor.
Combining FLIM with FRET can alleviate problems with direct acceptor excitation artifacts that complicate other methodology, and the technique can also be used to monitor FRET using acceptors that are not themselves fluorescent. However, there are limitations to FLIM that prevent it from becoming the most popular technique for FRET imaging. The primary consideration is that nanosecond lifetime measurements are exceedingly complex and must be conducted on expensive instrumentation that is not widely available. In addition, FLIM often requires several minutes to gather each image, which severely limits its application for fast dynamic events. A further complication is the multi-exponential lifetime decay curves that are typically encountered with many fluorophores, which usually require more comprehensive data collection strategies and complicate the FRET analysis. Finally, FLIM measurements are sensitive to environmental factors outside of FRET that can shorten the measured lifetime, including autofluorescence, viscosity, pH variations, and the presence of metallic ions. All of the variables just described reduce the effectiveness of using acceptor photobleaching and FLIM techniques alone, however, they represent important controls for verifying FRET measurements that are obtained by other methods.
The most basic and simplest technique for measuring FRET is known as sensitized emission (commonly termed two-color ratiometric imaging in the literature; see Figure 6), which can be performed on a standard widefield microscope equipped with the proper fluorescence filter sets. In sensitized emission, the donor fluorophore is excited by a specific wavelength band and the signal is gathered using two emission filter sets tuned for either the donor or acceptor fluorescence. The technique can generate results very quickly (limited only by the switching constrains of filter wheels) and is therefore quite useful in dynamic live-cell imaging. In the unlikely case that no bleed-through occurs between the excitation and emission of the two fluorophores, sensitized emission would be the predominant method for measuring FRET. Unfortunately, bleed-through is usually a significant problem, especially when using fluorescent proteins, and sensitized emission requires extensive control experiments in order to establish the presence or absence of FRET. Furthermore, these controls must be subjected to considerable image processing in order to subtract bleed-through, a limitation that slows acquisition times, increases the noise level, and introduces a relatively high degree of uncertainty into the measurements.
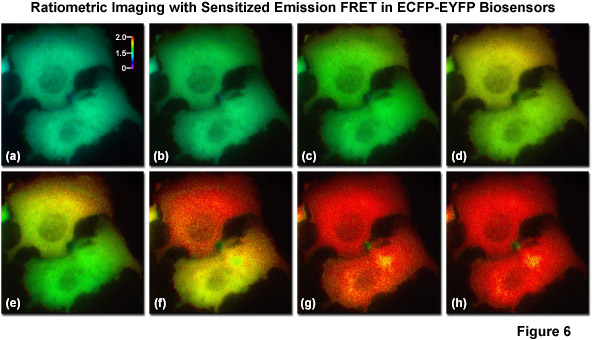
Illustrated in Figure 6 are a series of images captured in widefield fluorescence illumination of calcium waves traversing the cytoplasm of human carcinoma cells (HeLa) expressing the circularly permuted cameleon vector YC3.60. This biosensor contains variants of ECFP and EYFP that sandwich the protein calmodulin and the calcium calmodulin-binding domain of myosin light chain kinase (M13) domain in a linear chimera. In the presence of increasing levels of intracellular calcium, the M13 domain binds the calmodulin peptide to produce an increase in FRET between the fluorescent proteins. Presented in Figure 6(a) is a real color image of two adjacent cells before adding histamine to induce calcium binding to the biosensor. Figures 6(b) through 6(h) show pseudocolored ratio images of the calcium waves propagating through the cytoplasm of the two HeLa cells. Note that the wave travels from top to bottom in the upper cell and from right to left in the lower cell. The total time for the calcium wave to traverse the cytoplasm in these cells was approximately 1.5 seconds. The level of FRET is indicated by comparing the ratiometric pseudocolors to the legend presented in Figure 6(a). Images in Figure 6 were captured using a dual-band dichromatic beamsplitter coupled to excitation and emission filters tuned to the optimal wavelength bands for visualization of ECFP and EYFP with minimal bleed-through.
A number of corrective approaches have been described for sensitized emission using several different filter combinations with controls that contain only the donor, only the acceptor, or the FRET specimen with both donor and acceptor. The controls enable the investigator to determine the level of excitation and emission bleed-through and to subtract it from the FRET measurement. Because of all the necessary correction factors, however, the amount of noise in the final FRET image can exceed the level of sensitized emission in situations where interactions between the donor and acceptor are weak. On a positive note, when the FRET efficiency is large, sensitized emission is a quite useful technique, especially when applied to analysis of FRET biosensors containing fluorescent proteins, which typically exhibit high dynamic range. Sensitized emission can also be used for any intensity-based imaging system, including total internal reflection (TIRF), spinning disk, or laser scanning confocal microscopy.
back to top ^Spectral Imaging in FRET Measurements
In FRET applications, spectral imaging can be considered a variation of the sensitized emission technique that relies on excitation of the donor alone, followed by acquisition of the entire emission spectrum of both the donor and acceptor fluorescence instead of capturing data in two independent channels. Until the introduction of laser scanning confocal microscopes designed for spectral imaging, the technique was largely limited to spectroscopy experiments using cuvettes and purified fluorophores. Spectral imaging FRET assumes that gathering of the entire fluorescence spectrum will enable overlapping spectral profiles to be separated according to the distinct shapes of the spectra rather than simply monitoring emission intensity in a limited bandwidth region using a filter. Thus, by collecting the entire spectrum from both the donor and acceptor (see Figure 7(a)), it is possible with spectral imaging to determine the levels of donor and acceptor fluorescence, and from that information (combined with controls), to calculate the FRET efficiency.
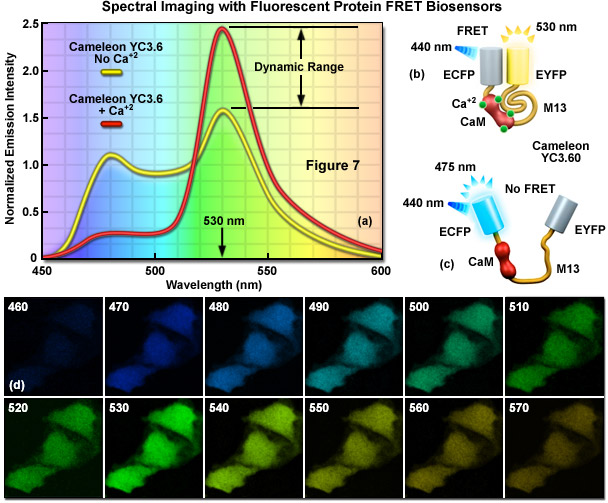
Presented in Figure 7 is a ratiometric spectral imaging measurement for the fluorescent protein calcium biosensor known as cameleon YC3.60, as described above. The spectral profiles of YC3.60 in the presence (red curve; Figure 7(a)) and absence (yellow curve) of calcium demonstrate the high dynamic range of the probe at 530 nanometers. Cartoon drawings of the cameleon biosensor are presented in the presence (Figure 7(b)) and absence (Figure 7(c)) of calcium to illustrate how the alkali metal induces a conformational change in M13 to relocate the two fluorescent protein moieties closer together. A lambda stack of images in 10-nanometer intervals of cells expressing the cameleon in the presence of high calcium concentration are shown in Figure 7(d). Note that the highest intensities are observed for the lambda plane containing emission wavelengths from 530 to 540 nanometers.
Comparisons between spectral imaging with linear unmixing and sensitized emission with two excitation wavelengths for the determination of FRET indicate that the signal-to-noise ratio for sensitized emission techniques is lower than that of spectral imaging (although this is not always the case and depends heavily on instrument parameters and configuration). This discrepancy is due to the fact that the relatively narrow bandwidth emission filters necessary to separate emission from closely overlapping fluorophores block the majority of usable photons, which are otherwise detected with spectral imaging. Discarding a large amount of the emission leads to significant loss of information, which in some cases approaches 50 percent of the available data. In addition, spectral imaging enables optimal weighting according to the noise present in individual data channels in contrast to traditional methods (often arbitrarily discarded). Spectral imaging requires the previous determination of the level of bleed-through due to direct excitation of the acceptor, but the technique can benefit from the use of two excitation wavelengths with instruments that are so equipped.
Spectral imaging confocal microscopes equipped with acousto-optic tunable filters (AOTFs) and specialized detector systems can be used to obtain a series of images in discrete, limited wavelength bands to generate what are termed lambda stacks (images of the lateral (x,y) plane as a function of wavelength). The spectral signatures (emission fingerprints) for individual fluorophores or fluorescent proteins and contaminating background signals (such as autofluorescence) are obtained from deconvolving the lambda stacks. The technique of linear unmixing can be applied to the lambda stack to separate the contributions of individual fluorophore signals in each pixel of the acquired image. Thus, spectral imaging coupled with linear unmixing can define and remove the contribution of bleed-through by the donor into the FRET signal. However, due to the fact that fluorescence emission produced by direct excitation of the acceptor (referred to as acceptor bleed-through, see above) is identical in spectral characteristics to the fluorescence signal produced by FRET, it is necessary to develop controls that help to identify and eliminate the contribution of acceptor bleed-through in order to obtain the FRET efficiency. Spectral imaging can also be combined with acceptor photobleaching or used to study dynamic changes in FRET efficiencies in fluorescent protein biosensors without the use of controls. The latter strategy is perhaps the most widely applied technique for examining FRET with spectral imaging.
For the elimination of acceptor spectral bleed-through emission due to cross excitation in spectral imaging FRET applications, most approaches are based on the assumption that, when imaged under identical conditions, the dynamics of these artifacts will essentially be the same in control cells that express the acceptor alone (as compared to the experimental cells that express both the donor and acceptor). However, due to the fact that different cells are used to establish the bleed-through contribution in the experimental cells, the individual pixel locations cannot be directly compared. In most cases, a comparison can be made between pixels in both the controls and experimental cells that have matching fluorescence levels. This technique relies on an algorithm that determines the pixel-by-pixel fluorescence levels and establishes the level of bleed-through in control cells that express only the acceptor. These control bleed-through values are then applied as a correction factor to the appropriate matching pixels in the experimental cells, which express both the donor and acceptor fluorophores.
In fluorescent protein FRET pairs that are constructed with variants of cyan and yellow fluorescent proteins (ECFP and EYFP), spectral imaging requires excitation of the cyan variant using a laser spectral line that overlaps with the fluorescent protein absorption profile. Modern confocal microscopes feature diode and gas lasers having spectral lines at 405, 440, and 458 nanometers, all of which are useful for excitation of cyan fluorescent proteins. However, the 458-nanometer spectral line from the argon-ion gas laser results in significant acceptor bleed-through (approximately 20 percent) into the FRET channel for ECFP-EYFP pairs. In contrast, the 405 and 440-nanometer diode lasers will generate less bleed-through (approximately 4 and 8 percent, respectively), but contaminating signal from direct acceptor excitation must still be removed to accurately calculate the FRET signal. After the ratio of the donor image intensities in the presence (IDA) and absence (ID) of the acceptor have been ascertained, FRET efficiency can be determined by applying the following relationship:
EFRET = 1 - (IDA/ID)
The calculation of FRET efficiency in this manner has been confirmed using fluorescent protein FRET pairs that were fused together with short peptide linkers, as well as the far more difficult task of examining FRET between probes that are expressed separately. The results generated very similar values for FRET efficiency when spectral imaging was compared with intensity-based and FLIM methodology. However, spectral imaging avoids the potential problems associated with bleed-through of the acceptor signal into the donor channel that is common in filter-based sensitized emission and multiphoton excitation imaging. On a note of caution, the acceptor spectral bleed-through component is often minor and can present problems in quantitatively assessing the level of signal when using photomultiplier detectors that have unstable response at very low intensity values. This artifact can be overcome by determining the bleed-through at different intensity levels in the control cells.
Cross-excitation of the acceptor can be avoided when choosing fluorescent protein FRET pairs that have a donor featuring a large Stokes shift. For example, mT-Sapphire and mAmetrine are GFP derivatives that absorb light in the ultraviolet wavelengths (approximately 400 nanometers), but emit either in the green (510 nanometers) or yellow (530 nanometers) spectral regions. When these donors are coupled with orange or red fluorescent protein acceptors, excitation of the FRET pair produces scant acceptor bleed-through and requires no correction factors or controls. As an example, coupling of a GFP derivative known as GFP2 with EYFP has produced a FRET pairing that can be excited with a 405-nanometer diode laser and successfully observed with spectral imaging. Because GFP2 and EYFP have highly overlapping emission spectra, linear unmixing of the FRET data is able to resolve the contribution of each fluorophore to the total fluorescence emission. Likewise, coupling mAmetrine with tandem-dimer Tomato (tdTomato) has produced a FRET pair that emits orange-red fluorescence upon excitation at 405 nanometers. Excitation of tdTomato alone at this wavelength produces virtually no detectable signal, thus correction for acceptor bleed-through is not necessary when using this pair. Similar FRET pairs will likely produce identical results.
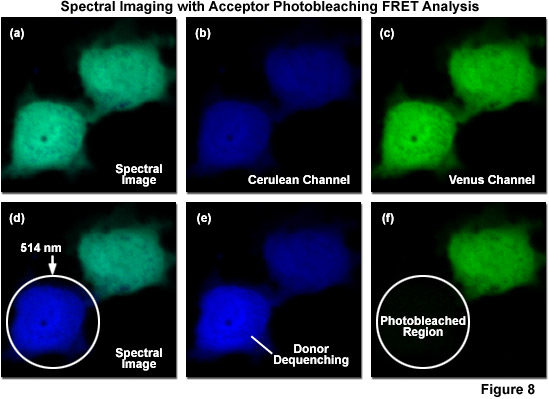
Due to the inability of spectral imaging confocal microscopy to distinguish between acceptor emission signal generated through FRET and that originating from direct excitation of the acceptor in fluorescent protein and other fluorophore pairs that have the highly overlapping spectral profiles necessary for FRET, several investigators have combined spectral imaging with acceptor photobleaching techniques to determine FRET efficiencies. Illustrated in Figure 8 is an example of spectral imaging of fluorescent proteins with acceptor photobleaching for FRET analysis. The fluorophore is a chimera of mCerulean and mVenus fused together with a 10-amino acid linker. When expressed in mammalian cells (Rabbit Kidney), the fusion vector spreads throughout the cytoplasm and enters the nucleus. A spectral image of the expressed vector in cells acquired from 450 to 650 nanometers is presented in Figure 8(a) with the spectrally resolved images of mCerulean and mVenus emission shown in Figures 8(b) and 8(c), respectively. Upon photobleaching mVenus in the cell shown in the lower portion of the window with 514-nanometer light (Figure 8(f)), fluorescence emission from mCerulean is increased (Figures 8(d) and 8(e)) as a consequence of donor dequenching.
Acceptor photobleaching is usually accomplished using a laser spectral line that overlays a high extinction coefficient region (as close to the peak as possible) within the absorption spectrum of the acceptor. For example, in the ECFP-EYFP FRET combination, the 514-nanometer argon-ion laser line is usually employed to photobleach EYFP, thus dequenching ECFP with a subsequent increase in donor signal (Figures 8(d)-8(f)). As EFYP is incrementally photobleached, spectral imaging lambda scans are conducted using the 548-nanometer argon-ion laser line (exciting ECFP) between each photobleaching event in order to record changes to the spectral response. In general, lambda stacks are gathered over a spectrum of wavelengths spanning 465 to 600 nanometers in discrete bandwidths (approximately 10 nanometers). This experimental approach is designed to minimize the error from individual measurements by fitting the changes in intensity to a standard curve. Values for the maximum increase in ECFP intensity can then be extrapolated from this curve, even if EYFP is never completely photobleached. The end goal is to avoid damage to the living cells and unwanted photobleaching of ECFP during the course of the experiment. Acceptor photobleaching techniques produce the optimum results when the donor is photostable and the acceptor is photoliable, a situation that can be controlled by selecting the proper fluorescent protein variants, such as Cerulean and Venus.
In order to calculate FRET efficiency using the acceptor photobleaching technique, a number of steps must be completed in the data analysis strategy. The first step consists of linear unmixing of the ECFP and EYFP components (or other fluorophores if they are used instead). Next, measurement of mean ECFP donor and EYFP acceptor intensities are followed by calculation of the changes in the intensities to determine FRET efficiency. After the lambda stacks have been acquired, linear unmixing is used to generate images of the ECFP donor and EYFP acceptor from the stacks. The overall success of linear unmixing depends on having specimens that exhibit good signal-to-noise and using reference spectra that faithfully represent the spectra contained in the FRET specimen. In most cases, cells expressing ECFP or EYFP alone (controls) are used to generate reference spectra. The control spectra should be acquired under identical conditions as those used for the FRET specimen, including gain settings, offset, wavelength range, objective, and dichromatic mirror. The images should be obtained with minimal signal saturation and the minimum pixel intensity set just above zero to obtain the largest possible dynamic range. After subtracting background, the FRET efficiency is calculated using the equation presented above where (IDA) and (ID) represent the normalized intensities of the donor before and after 100 percent photobleaching of the acceptor. Due to the fact that EYFP is almost never fully bleached, the value for (ID) is usually extrapolated from a linear fit of a plot describing the percent increase in ECFP emission versus the percent decrease in EYFP. The acceptor photobleaching technique can be used with other fluorescent protein pairs (such as EGFP and mKusabira Orange) in a similar manner.
A unique approach to measuring FRET with spectral imaging has been termed lambda FRET, and has proven to be a highly specific, sensitive, and robust method for analyzing resonance energy transfer in live cells. The lambda FRET algorithm relies on imaging of a FRET specimen at multiple emission wavelengths, followed by separation of the FRET spectrum into its donor and acceptor components to obtain a pixel-based calculation of FRET efficiency. Lambda FRET applies a novel pre-calibration procedure to correct for spectral bleed-through based on the acquisition of reference reflection images, and has been validated using synthetic fluorophore FRET standards (such as Alexa Fluor 488 and Cy3), as well as fluorescent protein fusions (ECFP and EYFP) with variable linker lengths and stoichiometries. The unique correction procedure based on the use of reflection images to normalize for different radiation light intensities is similar in principle to sensitized emission techniques, but produces results with lower noise contamination. Lambda FRET has been demonstrated to be useful in cases where high spectral overlap and autofluorescence artifacts are present in both fixed and live-cell imaging scenarios.
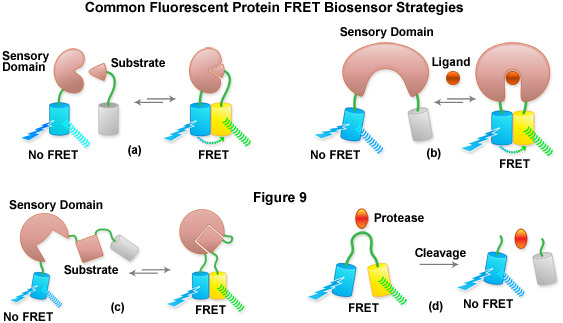
Aside from the examination of intermolecular interactions and determining of FRET efficiency using acceptor photobleaching and bleed-through correction techniques, spectral imaging has been very useful for the examination of fluorescent protein biosensors to determine the presence or absence of FRET in response to a biological stimulus. The methodology requires obtaining a spectrum of the biosensor in the presence and absence of the stimulator to determine whether FRET is observed or eliminated and to monitor the dynamic range of the response (see Figure 7). Thus, by creatively fusing pairs of fluorescent proteins to biopolymers that perform critical functions involved in various aspects of physiological signaling or other biological activities, a number of investigators have developed a host of new molecular probes that are useful for optical live-cell imaging of important metabolic and signaling processes. Typically, two fluorescent proteins (usually a cyan and yellow variant) are inserted on opposing ends of a sensor protein or peptide sequence (see Figure 9), as briefly described above. Changes in the conformation of the sensor protein produce corresponding tertiary alterations in the structural organization of the complex, and thus, the level of FRET that can be observed between the flanking fluorescent proteins. A ratiometric change in the fluorescence output of the donor and acceptor using a single excitation parameter coupled with spectral imaging is becoming a popular methodology to examine these biosensors.
Presented in Figure 9 is a cartoon illustrating common fluorescent protein biosensor construction strategies. Cyan cylinders represent CFPs, gray cylinders represent YFPs without FRET, and yellow cylinders represent YFPs with FRET. Blue lightning bolts indicate excitation at 450 nanometers and parallel waves are fluorescence emission (at 475 nanometers, cyan; or 530 nanometers, yellow). Sensory domains are flesh-colored and effector agents are spheres or ellipses. Figure 9(a) shows intermolecular FRET between a separate sensory domain and substrate fused to CFP and YFP, respectively, while Figure 9(b) depicts a fluorescent protein biosensor featuring a single sensory domain and effector ligand. Binding of the substrate to the sensory domain in Figure 9(a) produces FRET whereas binding of the ligand in Figure 9(b) induces a conformational change in the sensory domain to bring the fluorescent proteins into the correct proximity for energy transfer (see also Figures 7(b) and 7(c)). In some cases, the substrate and sensory protein domains are linked (Figure 9(c)) to create a single genetic expression unit for intramolecular FRET as opposed to the situation in Figure 9(a). A fluorescent protein biosensor that detects substrate cleavage (Figure 1 and Figure 9(d)) operates through the elimination of FRET after the appropriate protease has been induced. Protease cleavage biosensors are popular indicators of apoptosis.
Over the past several years, a large number of novel biosensors using various FRET pairs have been reported. Despite limitations in dynamic range observed in several FRET biosensors using cyan and yellow derivatives, the use of these fluorescent proteins has been widely adopted, probably due to the simplicity of ratiometric measurements, widespread availability, and the ease of comparisons to other sensors having similar properties. Alternative FRET pairings are beginning to emerge, including cyan and teal donor fluorescent proteins coupled to yellow and orange acceptor fluorescent proteins, as well as green fluorescent protein donors coupled to red fluorescent protein acceptors. However to date, the usefulness of fluorescent proteins obtained from reef corals and sea anemones is limited. Several promising biosensors match a Sapphire or yellow GFP derivative with a red fluorescent protein to produce a long Stokes shift reporter, as discussed above. Advanced biosensors will no doubt emerge using more finely tuned fluorescent protein combinations that serve to increase the dynamic range and other properties of this highly useful class of probes. Toward that end, spectral imaging combined with linear unmixing will continue to see increasing duty as one of the methods of choice for FRET analysis.
Conclusions
A number of techniques have been developed for the analysis of FRET in fluorescent proteins as well as synthetic dyes and quantum dots. For live cell imaging, spectral imaging combined with linear unmixing provides a robust method for the measurement of FRET using fluorophores with highly overlapping spectral profiles, a situation that is typically encountered with FRET specimens. New fluorescent protein biosensors promise to expand the horizons of dynamic investigations into subcellular activities and spectral imaging should prove to be a highly useful tool in this arena. In order to further improve analytical techniques, spectral imaging can be combined with lifetime or acceptor photobleaching techniques. Furthermore, the potential to conduct FRET experiments using two different acceptors (having dissimilar emission spectra) is within the realm of spectral imaging, but far more difficult to perform using traditional methodology.
Contributing Authors
David W. Piston - Department of Molecular Physiology and Biophysics, Vanderbilt University Medical Center, 702 Light Hall, Nashville, Tennessee, 37232.
Mary E. Dickinson - Department of Molecular Physiology and Biophysics, One Baylor Plaza BCM 335, Baylor College of Medicine, Houston, Texas, 77030.
Michael W. Davidson - National High Magnetic Field Laboratory, 1800 East Paul Dirac Dr., The Florida State University, Tallahassee, Florida, 32310.